The recent introduction of the MSA Index and the expectation that some processors will move to a payment system whereby animals with higher MSA Index carcases will attract a premium price has caused renewed interest in the marbling potential of animals. While the MSA Index is influenced by multiple factors, both environmental and genetic, the genetic factor with the largest influence on the MSA Index is marbling. The marbling of the carcase describes the flecks of intramuscular fat that are spread throughout the meat, with higher marbling generally associated with improved eating quality. Therefore, carcases with higher marbling will generally have better MSA Index values than those carcases with less marbling. It is timely to explore the current state of IMF% in Australian Hereford, and examine ways in which Australian Hereford breeders can improve IMF% in their animals.
Measuring Marbling
One of the carcase EBVs which BREEDPLAN produces is the Intramuscular Fat (IMF%) EBV. This IMF% EBV is an estimate of the genetic difference between animals in intramuscular fat (marbling) at the 12/13th rib site in a standard weight steer carcase. Larger, more positive IMF% EBVs are generally more favourable. For example an animal with an IMF EBV of +0.8% would be expected to produce progeny that would express more marbling in its progeny than an animal with an IMF EBV of +0.1%.
Information used in the calculation of the IMF% EBV comes into BREEDPLAN from two sources; either from measurements taken on the carcase of an animal, or from ultrasound scanning measurements taken on live animals. Very little carcase data comes into BREEDPLAN, and when it does, it comes from structured progeny tests. The steers from the Hereford Progeny Test Project are a good example – carcase data on these steers has been submitted to BREEDPLAN for inclusion in the analysis. However, the majority of data recorded with BREEDPLAN is in the form of ultrasound scanning records, as this is how seedstock producers are able to collect information on carcase traits in their breeding stock.
When collecting ultrasound scanning measurements on your animals:
- Use an Accredited Scanner
Scan information will only be accepted by BREEDPLAN if it has been recorded by an accredited
scanner. A list of accredited scanners can be accessed from the “Accredited Technicians”
page within the Technical area of the BREEDPLAN website (http://breedplan.une.edu.au). - Scan you animals when they are between 300‐800 days of age
BREEDPLAN can analyse the scanning performance from animals that are between
300 and 800 days of age when measured. Most animals are scanned at approximately 600
days of age. - Only scan animals when they are in good condition
The condition of animals should be the most important factor when deciding whether to scan
your animals. BREEDPLAN recommends that the animals have a minimum average rump fat
of 4‐5 mm and minimum average rib fat of 3 mm. The IMF results will be optimised if the
majority of animals have between approximately 2% and 8% IMF when scanned. - Scan all animals ‐ not just bulls
Heifers provide valuable data for marbling as they mature earlier than the males. Scanning
steers will provide useful information for their sires and dams. - Scan all animals within a management group
As with any trait, it is important to record all animals within the management group.
Submitting scan data on a subset of your animals may result in data biases and the subsequent
calculation of carcase EBVs that do not reflect the true genetic merit of your animals. - BREEDPLAN only analyses the first set of scanning information
While more than one set of scanning measurements can be recorded for an individual
animal, BREEDPLAN analyses only the first set of scanning information.
Are Hereford Breeders Recording Imf% Data With Breedplan?
The 1993 drop was the first Hereford calving drop to have ultrasound scan data for IMF%, with 91 animals, representing just 0.13% of the 1993 drop, having IMF% records (Figure 1). For the next few years, only a very small percentage of the total drop had IMF% recorded. A big jump occurred between 1997 and 1998, with 10.59% of the 1998 drop having IMF% recorded compared to 3.19% of the 1997 drop. From 1998 until 2010, the percentage of each drop with IMF% recorded continued to rise steadily. From 2010 to 2013, the percentage of each drop with IMF% recorded has remained fairly constant, with between 33.5% and 36.7% of the drop in these years having IMF% recorded. The current drop of calves to have scanning records recorded is the 2013 drop; 36.7% currently have IMF%records.
When the IMF% performance recording trends of males versus females are compared, it is obvious that a greater percentage of male animals than female animals are scanned each year (Figure 2). This is likely due to a number of factors, including:
- some beef producers opting to only scan their sale bulls
- some beef producers opting to only scan their show team
- cost of scanning prohibiting scanning of the entire herd
IMF% ultrasound scanning records for heifers provide valuable information for the BREEDPLAN analysis. This is because heifers mature earlier than bulls, and thus display a greater range of IMF% variation compared to bull. This larger spread of variation is extremely valuable for genetic analysis.
Therefore BREEDPLAN continues to recommend that Hereford breeds scan their heifers and steers in addition to their bulls.
Has The Hereford Breed Made Genetic Progress In Imf%?
Despite the increase in the percentage of Hereford animals with ultrasound IMF% data recorded with BREEDPAN (which is encouraging, as the trait needs to be recorded for progress to be made), there has been little change in the average IMF% EBV for the Australian Hereford between 1989 and 2014 (Figure 3). This lack of genetic progress for IMF% is reflective of the limited progress that has been made for most carcase traits in Australian Hereford over this time period, with very little change observed in the average EBV for Retail Beef Yield, Rib Fat or Rump Fat (Figure 3). The exception to this is EMA, with the average EBV for EMA increasing between 1989 and 2014 (Figure 3).
The question then is why has there been no progress made for IMF% (and other carcase trait) in Australian Hereford? Is this a matter of it being impossible to make genetic progress for IMF% in Hereford, or is the lack of genetic progress due to other factors? There is genetic variation for IMF% within the Hereford population, indicating that it is possible to make genetic progress for the trait.
This variation can be seen by examining the percentile bands for Australian Hereford; in the 2013 calving drop, the difference between the top value for IMF and the top 99% percentile value for IMF was 3.6%. Furthermore, the fact that is possible to make genetic progress for IMF% in Australian Hereford is demonstrated by a number of herds which have done just that. A case study of one such herd is discussed below.
Can Genetic Improvement In Imf% Be Achieved? – A Case Study
The Australian Hereford herd used for this case study is moderately sized, registering approximately 125 calves per year. When the genetic trends for IMF% are examined for this herd, it is clear that from 1996 until 2011, the average IMF% EBV fluctuated slightly, hitting a high of +0.2% in 2006 and 2007 before falling to ‐0.1% in 2011 (Figure 4). However, the average IMF% EBV of the 2012 drop calves in the herd jumped to +0.4%, an increase of +0.5% compared to the average IMF% EBV of the 2011 calving drop in the herd (Figure 4). The average IMF% EBV of the 2013 and 2014 calves in the herd remained fairly stable, but another jump in the average IMF% EBV was observed in the 2015 drop calves (Figure 4). The average IMF% EBV of the 2015 drop was +0.9%, an increase of +0.5% compared to the average IMF% EBV of the 2014 drop calves in the herd (Figure 4). Note that the average EBVs for IMF% of the 2015 drop calves are based on mid parent values but are a good indication of what the average EBVs will be after scanning results are included. In just five years, this herd has managed to lift the average IMF% EBV of their calves from ‐0.1% (2011) to +0.9% (2015), an increase of +1.0%. In contrast, the breed average IMF% EBV in this time period has gone from +0.1%
(2011) to +0.5% (2015), an increase of just 0.4%. The case study herd has made progress in IMF% at just over twice the rate of the Hereford breed as a whole.
So how did this herd do it? What allowed them to make these improvements in IMF%? The answer lies in part in the sires that this herd has used over the past 5 years. The two big improvements in IMF% occurred in this herd between 2011 and 2012, and between 2014 and 2015. Examining the dams of the 2011 and 2012 calves indicates that there is no difference in the average IMF% EBV of the 2011 dams and the 2012 dams; both groups had an average IMF% EBV of +0.1%. However, the average IMF% EBV of the 2011 sires was ‐0.2% (ranging from +0.8% to ‐0.8%), while the average IMF% EBV of the 2012 sires was +0.6% (ranging from +2.5% to ‐0.6%). This sire average does not tell the whole story, as some sires in each year sired only a few calves. The difference in the sires used between the two years is further emphasised when the IMF% EBVs of the four most heavily used sires in each year is examined. In 2011, the four most heavily used sires had an average IMF% EBV of ‐0.4%; in contrast, the four most heavily used sires in 2012 had an average IMF% EBV of 1.0%.
A similar trend emerges when the differences between the 2014 and 2015 sires are examined. The average IMF% EBV of the 2014 sires was +0.5%, while the average IMF% of the 2015 sires was +1.2%. However, the dams have also had some influence on this second big improvement in IMF%; the average IMF% of the 2014 dams was +0.2% while the average IMF% of the 2015 dams was +0.5%. Clearly, the choice of sires and, to a lesser extent, the selection of dams, has played an important rolein driving genetic improvement in IMF% in this herd.
While this case study herd was successfully making genetic progress in IMF%, what happened to the other economically important traits within their herd? To answer this question, the genetic trends of the Grain Fed Steer Index have been examined for both the herd and the society. Selection indexes, such as the Grain Fed Steer Index, provide an overall “EBV” of an animal’s genetic value for a specific market and breeding system, and are expressed in dollars. The selection index puts weightings on
economically important traits, allowing seedstock producers to “balance” progress in these traits.
Figure 5 shows, as IMF% improved in the herd, the Grain Fed Steer Index also improved. In fact, it may be that the genetic progress made in IMF% is a reflection of the herd selecting for improved Grain Fed Steer Index, and not the other way around (of the four Hereford Selection Indexes, the Grain Fed Steer Index has the most emphasis on IMF%). While the average genetic improvement in the Grain Fed Steer index over the past five years was $2.69 per cow mated per year, the average genetic improvement in the Grain Fed Steer index in the case study herd was $8.50 per cow mated per year. Not only has this herd been improving IMF% at double the rate of the Hereford breed as a whole, but they have also been increasing the economic value of their herd at just over three times the rate of the Hereford breed as a whole. Therefore, it is clearly possible to make genetic progress in IMF% while also making genetic progress in other economically important traits.
Breeding For Improved Imf%
How can Hereford breeders do what the case study herd has done, and improve IMF% while also continuing to make genetic progress in other traits of economic importance? SBTS suggest that Hereford breeders use a two‐step process to select animals (e.g. when selecting bulls for breeding purposes). The first step of this process involves Hereford breeders identifying the Hereford selection index of most relevance to them, and using this selection index to do an initial rank of animals. Following this, breeders should do a secondary selection, whereby they consider the individual EBVs of each animal and remove any animal which does not have desirable EBVs for the trait/s of interest. For example, a Hereford breeder might decide to do an initial selection of bulls in the top 10% of the breed for the Grain Fed Steer Index. The Hereford breeder may then impose a second selection criterion, whereby the bulls must also be in the top 10% of the breed for IMF%. The ‘EBV Enquiry’ search facility on Internet Solutions will allow Hereford breeders to work through this process, by entering minimum criteria for individual EBVs and/or Selection Indexes.
- Take Home Messages
Ultrasound scanning allows seedstock producers to collect IMF% data on live animals. Heifers tend to mature earlier than males, and so contribute valuable information to
BREEDPLAN for calculating IMF% EBVs. - While limited progress has been made in IMF% at a breed level, genetic variation in IMF% does exist in Australian Hereford. Therefore, as the case study showed, it is possible to improve the IMF% in Hereford quite quickly.
- Improving IMF% does not mean you have to sacrifice genetic progress in other important economic traits – use a selection index (e.g. Grain Fed Steer Index) to rank sires, and do a secondary selection on traits of interest (e.g. IMF%).
- With the right strategy, genetic progress can be made quickly. It is possible to go from below average to above average in a short time period.
For further information on any of the topics covered in this article, please contact Catriona Millen, SBTS Technical Officer, on (02) 6773 3357 or on 0409 102 644. Catriona can also be reached via email at catriona@sbts.une.edu.
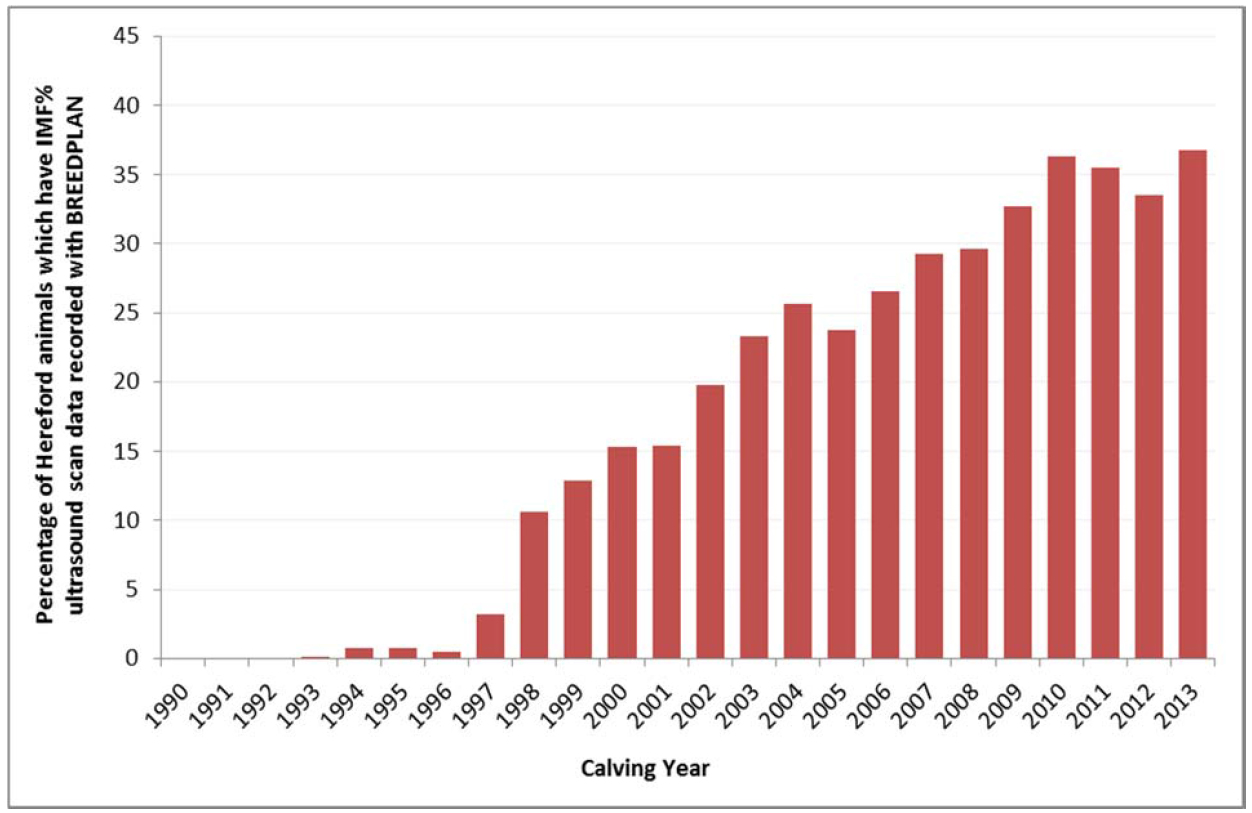
Figure 1. The percentage of Hereford animals in each calving year (1990‐2013) which have IMF% ultrasound scan data recorded with BREEDPLAN.
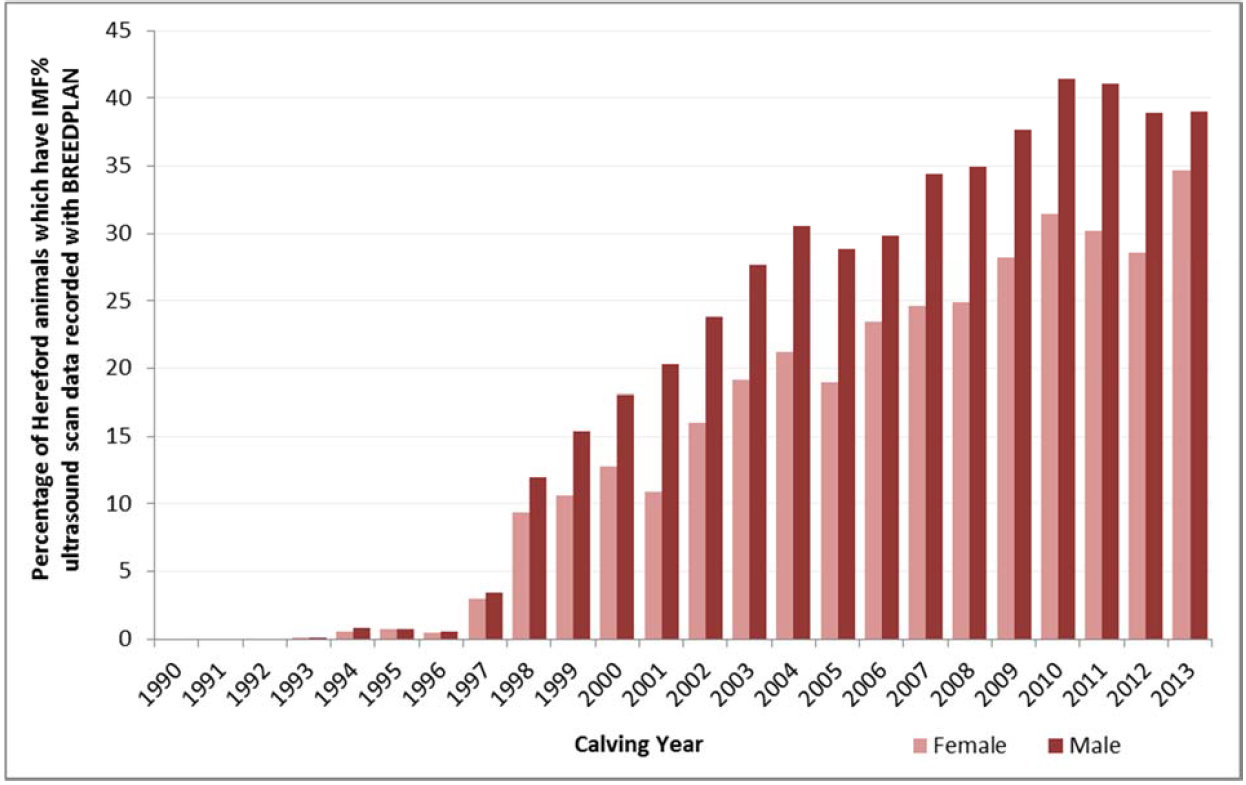
Figure 2. The percentage of male and female Hereford animals in each calving year (1990‐2013) which have IMF% ultrasound scan data recorded with BREEDPLAN.
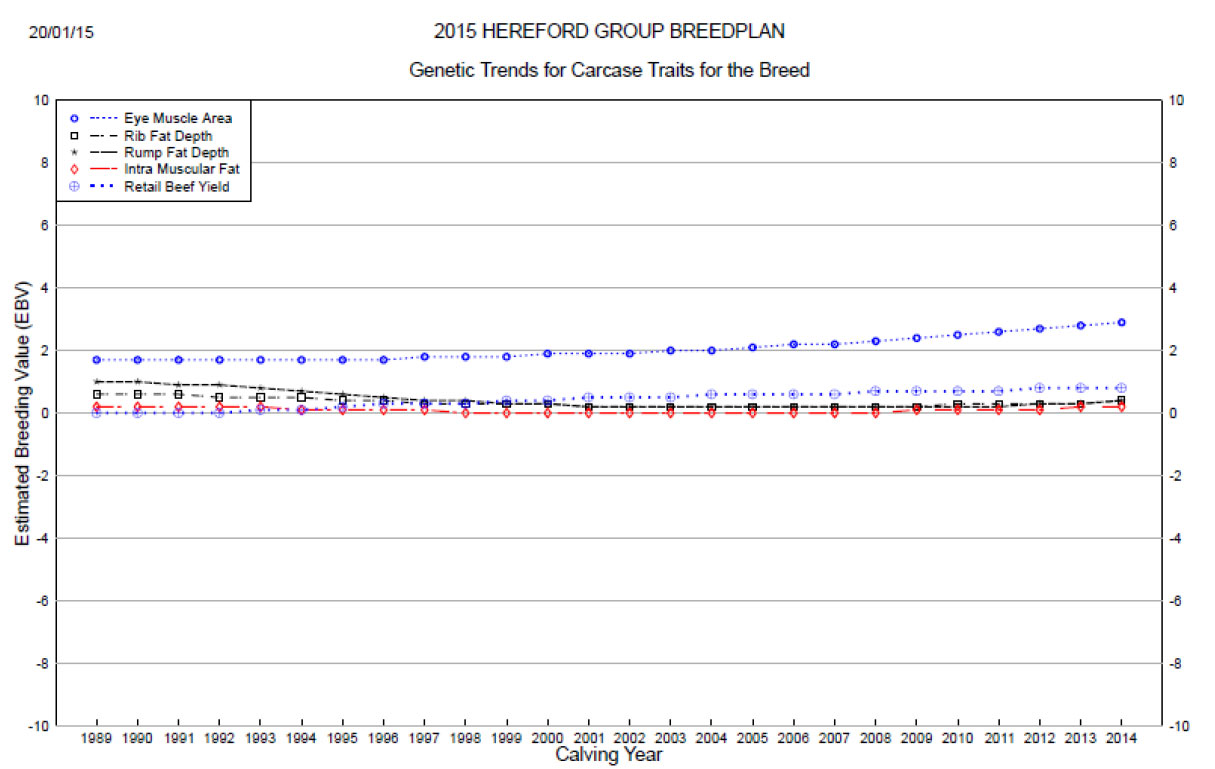
Figure 3. Genetic trends for carcase traits in Australian Hereford following the June 2015 Hereford GROUP BREEDPLAN analysis.
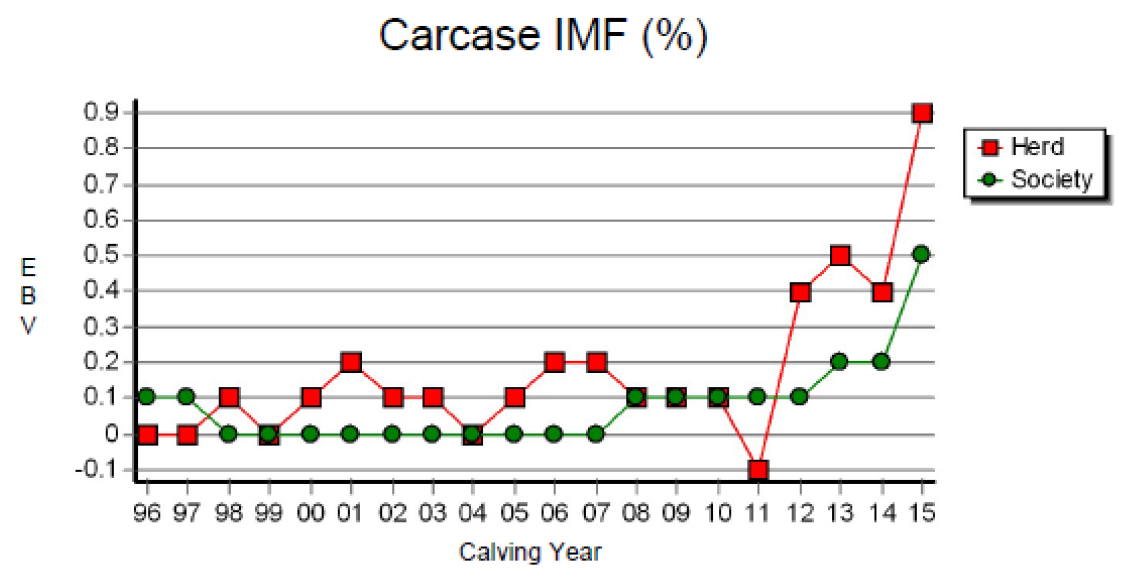
Figure 4. Carcase IMF% genetic trends for the case study herd (herd, red square) and Australian Hereford (Breed, green circle).
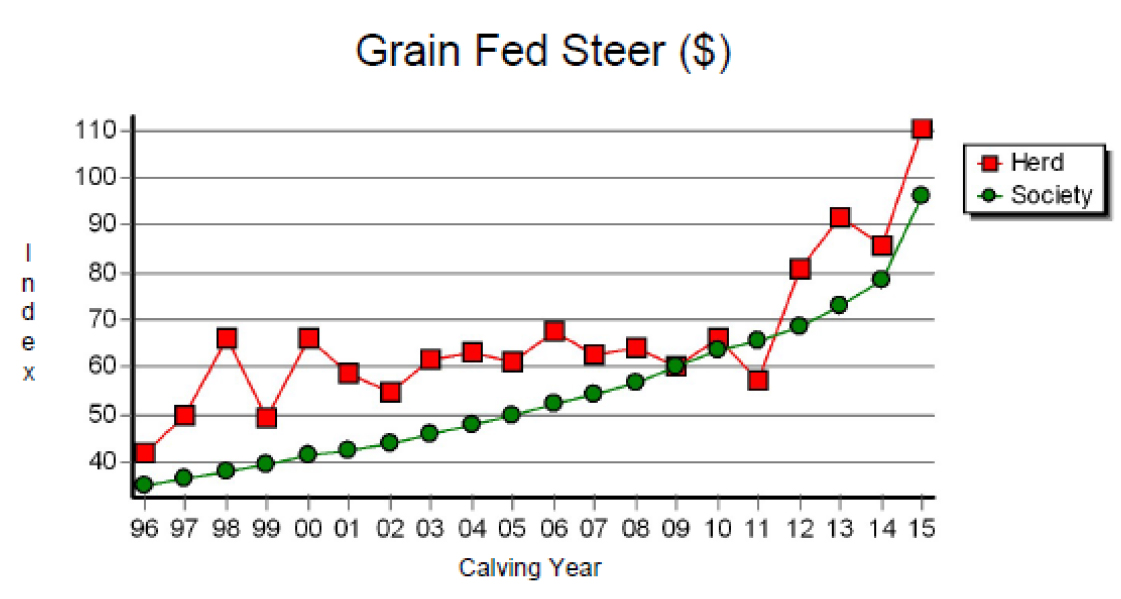
Figure 5. Grain Fed Steer genetic trends for the case study herd (herd, red square) and Australian Hereford (Breed, green circle).
